Core Analysis Tools
The Omics platform is uniquely built around powerful, scalable analysis pipelines spanning single-omics features, robust Multi-Omics networking, and Pathways correlation testing.
Single-Omics Analysis
The standard Analysis Configuration page provides form-driven models to run Correlation analysis, PCA matrices, and specialized Machine Learning implementations like Random Forests securely against a loaded dataset.
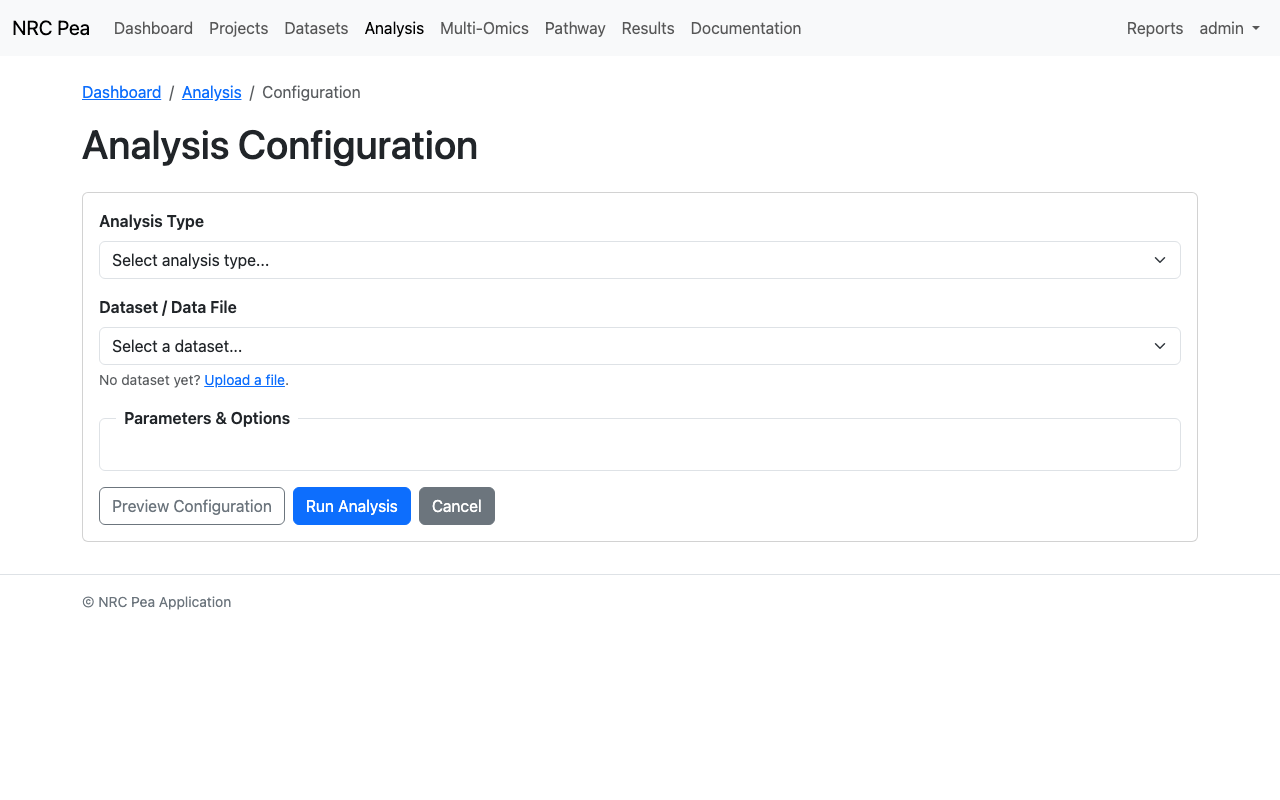
Analysis Configuration Interface
Multi-Omics Integration
Multi-Omics configurations enable users to fuse orthogonal datasets (e.g. transcriptomics with metabolomics) to find multi-variable biological drivers using models like PLS-DA and DIABLO.
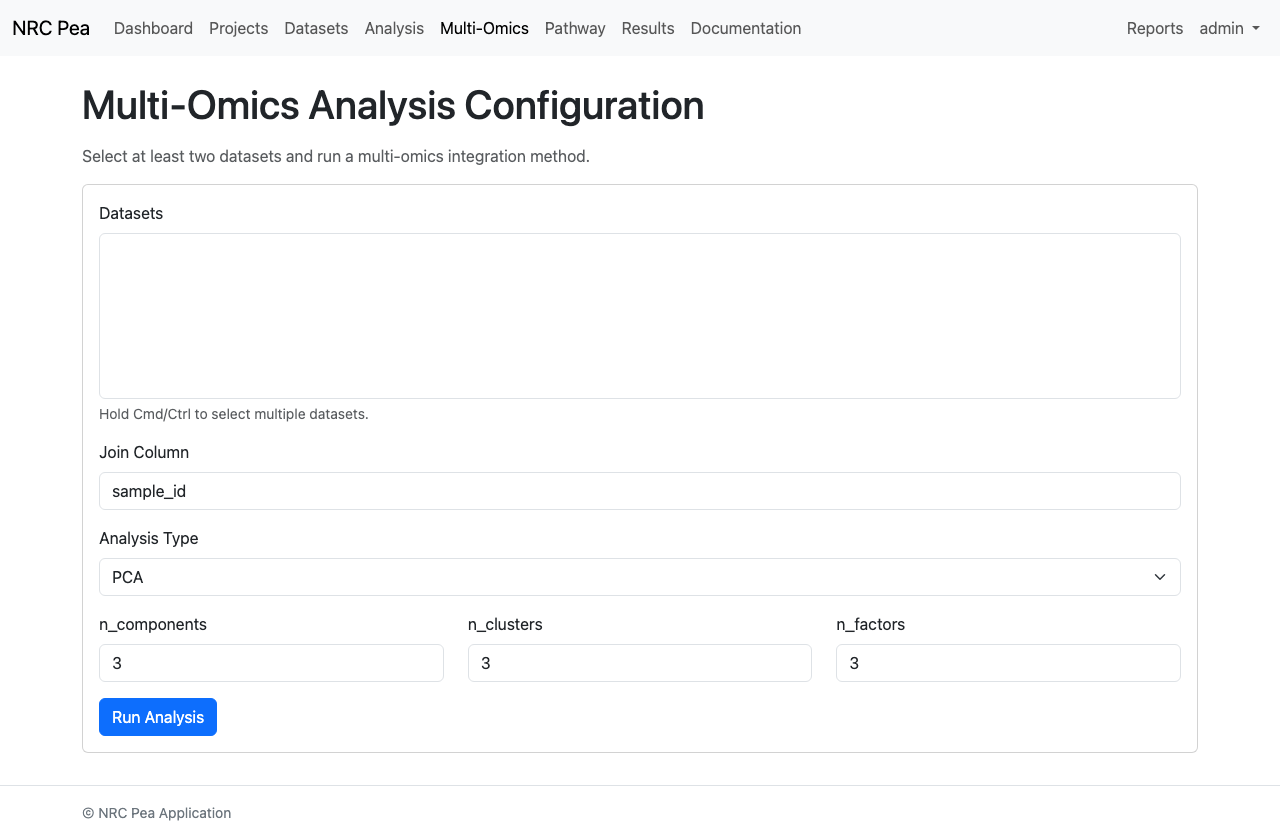
Multi-Omics Setup
Pathway Analysis
Direct biological context mapping is executed within the Pathway Analysis tool, leveraging databases like KEGG to calculate Over-Representation Analysis (ORA).
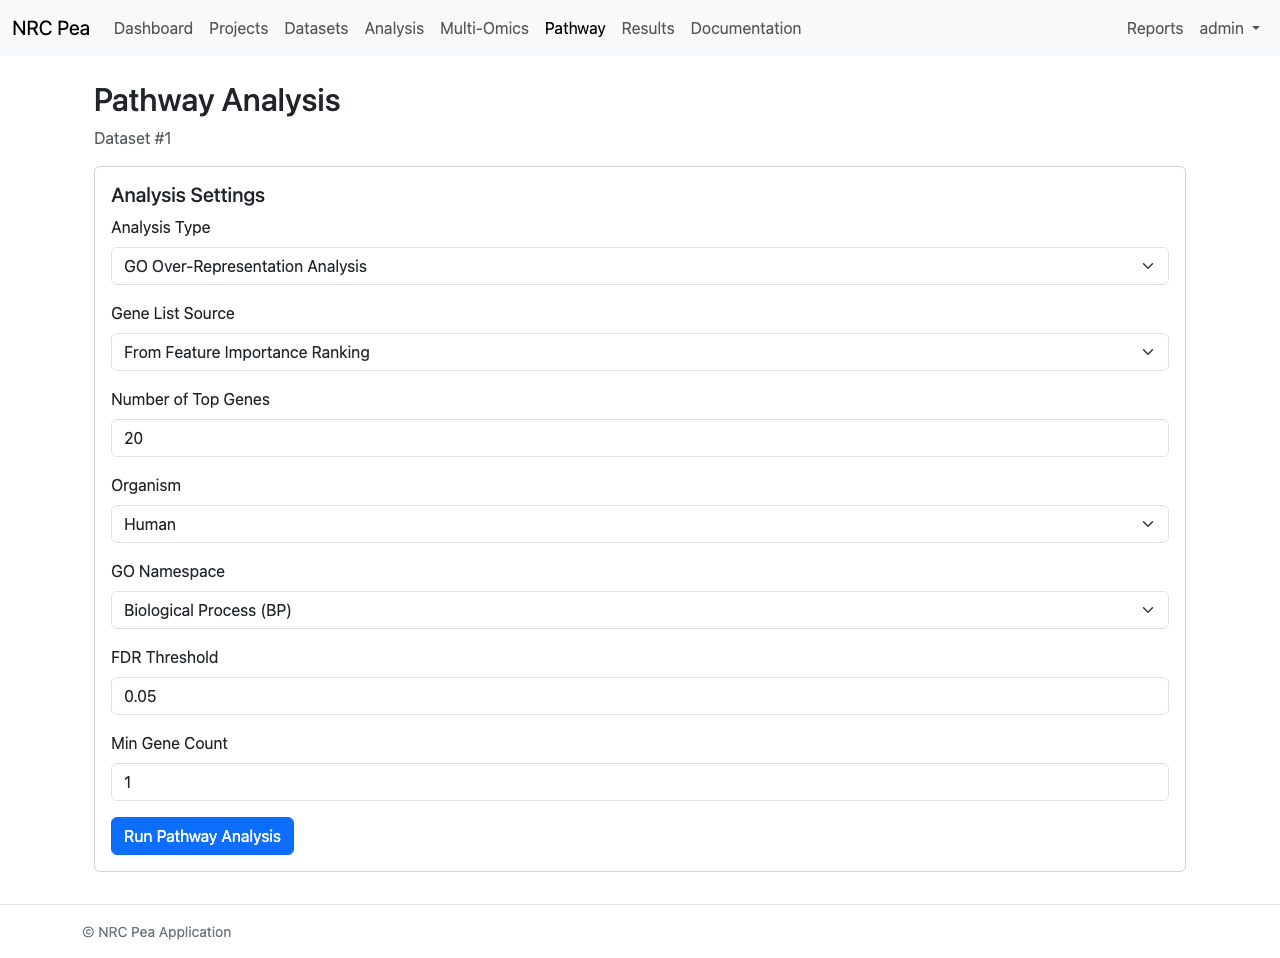
Pathway Investigation Panel
Parameter Reference Guide
Detailed technical specifications for the core configuration parameters available in the analysis modules.
Analysis Type
Defines the high-level methodology (e.g., Random Forest, Correlation, or GWAS Screening). Controls which downstream parameters are visible.
Number of Estimators
The number of decision trees in the ensemble model. Higher values lead to more stable models but require more memory.
Number of CV Splits
The $k$ partitions used for $k$-fold cross-validation. Typical academic baseline is 5 or 10.
Test Size
Proportion of the dataset used for validation (e.g., 0.2 represents 20% for testing).
Random State (Seed)
Integer seed value ensuring that stochastic operations (like dataset splitting) are identically reproducible across runs.
Correlation Method
Determines how to measure feature association: Pearson (linear), Spearman (rank), or Kendall (robust).
FDR Threshold (q-value)
The false discovery rate cutoff (Benjamini-Hochberg) for reporting significant biological findings.
Permutation Repeats
The number of shuffles performed to generate internal null distributions for feature importance significance testing.
SHAP Analysis Coverage
Enables calculation of Shapley values for model local interpretability, identifying variable contribution per sample.
Gene List Source
Input selection for enrichment. Utilizes high-ranking features from Random Forest or manually curated user lists.
Feature Subset Size (Top N)
The count of highest-ranking genes to include in ORA calculations.
Biological Organism
Species context for gene ID mapping (e.g., Human vs specialized genomic backends).
GO Namespace
Specifies which Gene Ontology branch to query: Biological Process, Molecular Function, or Cellular Component.
Minimum Overlap Threshold
The minimum number of provided genes required within a pathway to trigger statistical testing.